
Newsletter | Summer 2022.

.

Statistics are here! ✨
Discover now our new statistic tools in Analytics to easily interpret your protocol results.
Easily navigate, clearly see and quickly determine the effects of your products on your subjects to optimize your decision making.
We explain the new features right below👇
Summary |
Top Session Statistics 🥇 |
Individual Statistics 🧠 |
Different Analytics Tabs 📊 |

Top Session Statistics.
In the Neuromarker tab, the Top Session section allows you to directly estimate significant differences between your groups and sessions.
If you need more complete information, you can use the Detailed Statistics tab to access in-depth tables.
Evaluate the effects of your products.
Now, for each product, assess whether there is an increase or decrease in a given mental state within a group of users, thanks to these items:
✔ The column Evolution percentage gives the difference of the Neuromarker level between the stimulation or resting state and the baseline.
✔ The column Subjects impacted gives the proportion of subjects who experienced the observed effect.
✔ The column Conclusion helps you interpret the result of the statistical test.

Compare the effects of your products.
By comparing the sessions to each other, evaluate the significant differences in the effects of your products.
This way you can determine if your Product A is more effective than your Product B for a given mental state, for example.


Individual Statistics.
In the Neuromarker tab, the first graph let you know the Neuromarker change across users for any of your products.
Just hover each color on the graph to find out how many subjects experienced an increase, decrease or no change in their mental states.


The different Analytics Tabs.
We have improved the ergonomics of our Analytics section to make it easier to navigate between the different Analytics tabs.
Neuromarkers Tab.

Here, you can access the results of each Neuromarker as a graph with different types of visualization.
As previously seen, the Top Session section, on the left, provides you a synthetic view of the most significant results.
Also, the ability to switch between the different Neuromarkers and compare each recording, gives you an overview of your experiments.
Quantitative EEG Tab.

It’ s available again in the Analytics!
You can visualize the ratio between the stimulation or resting state and the baseline for each sessions for each frequency band and compare them!
An information pop-up is there to help you easily interpret these results. Understanding which frequency band is related to which mental state becomes a breeze.

Detailed Statistics Tab.

If you need detailed informations for your external reports, or for writing your scientific papers, here what you will find in this section:
✔ The details of the statistics calculated with the p values.
✔ The tests performed.
✔ The summary tables of the results for each session and each session comparison.

© 2022 myBrain Technologies, All rights reserved.
50 Avenue Claude Vellefaux
75010 Paris
Related Articles

A milestone for NeuroEthics
Neurotechnologies are no longer confined to research laboratories. They are fully integrated in our societies, whether in the medical field or beyond.
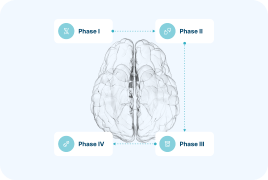
The benefits of collecting EEG neuroimaging insights in clinical trials.
In clinical trials, brain monitoring EEG is facilitating the measurement of complex clinical endpoints. EEG as a biomarker provides safe, objective an
Newsletter | December 2022.
During this year of 2022, we have dedicated ourselves to make our solution more complete and ergonomic through many updates designed to optimize th
Newsletter | November 2022.
The end of 2022 marks a major step forward in the neurotechnology sector in France: the presentation of a Charter for a responsible development of ne

A milestone for NeuroEthics.
The capacity of neurotechnologies to probe and interfere with brain activity challenges notions of identity, integrity and autonomy of human being. Re

Newsletter | October 2022.
To travel miles in full peace of mind, in a car that understands and anticipates every need of the driver on the road, is becoming a reality! With it

Newsletter | September 2022.
myBrain Technologies is committed to provide the most accurate offer possible to support its customers in the development of their products. With the

Newsletter | Summer 2022.
Statistics are here! Discover now our new statistic tools in Analytics to easily interpret your protocol results. Easily navigate, clearly see and qu

Newsletter | June 2022.
As a company that has developed a solution based on Artificial Intelligence (AI) and neuroscience ans as manufacturer of Medical Devices (MD), myBrain
![[DOWNLOAD] Artificial Intelligence Act: What future for AI in Europe?](https://emmanuel-guerin.fr/dev-mybraintech/wp-content/uploads/2022/06/white-paper-artificial-intellifence-act.png)
[DOWNLOAD] Artificial Intelligence Act: What future for AI in Europe?
With the increasing evolution of computing, robotics, and new technologies, AI is now a major part of our daily life. On April 21, 2021, the European
myBrain Technologies’s eye on Medical Device Regulation.
In order to improve health safety and harmonize rules within the EU, the Medical Device Regulation has been profoundly revised, resulting in new regul

Newsletter | May 2022.
Our brain still holds many secrets, both in its functionning and in its normal development. Thanks to the latest neurosciences techniques and tools, i

NeuroAeronautics: brain wave monitoring in the ‘Cockpit of the Future’.
A cockpit is a highly sensitive area, where attention and mental workload have to be optimized. Latest neurotechnologies, including EEG, can track bra
Newsletter | April 2022.
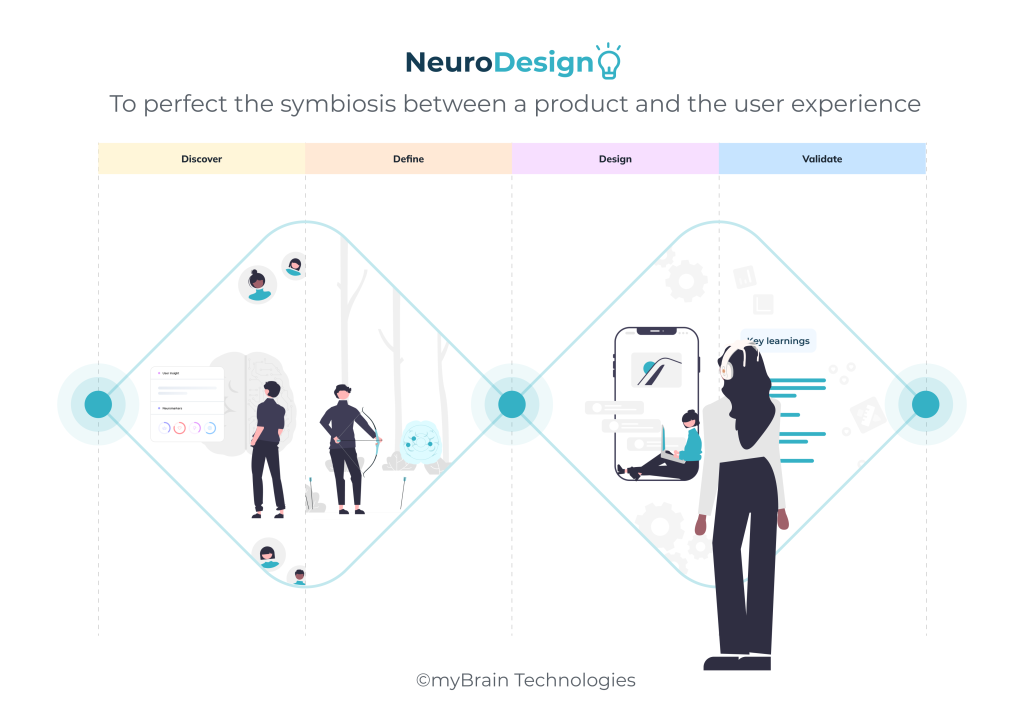
This month, the spotlight is on user experience that our Product Team keep on improving. We aim to focus on our customer's feedback to optimize our so

NeuroDesign: to perfect the symbiosis between a product and the user experience.
One of the key aspects of product strategy is to generate, identify and leverage insights that will provide the foundation to reach business objective

Newsletter | March 2022.
Hi there! The cosmetic industry has been interested for a while in exploring the links between the brain and the nervous system. The recent advances i

NeuroCosmetics in skincare.
Cutting edge “neuro-IA” technologies can detect the physiological impact of a cosmetic product using real-time consumers’ emotional data collect
Newsletter | February 2022.
First of all, we're deeply happy to have seen so many of you reading us last month and we thank you very much! Today, we are proud to announce that o

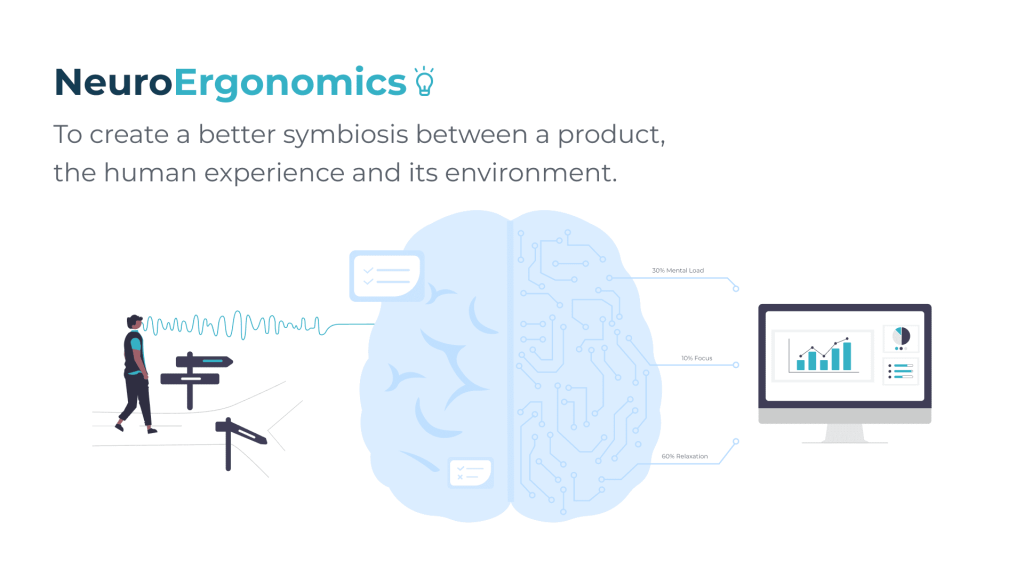
Neuroergonomics: towards a new paradigm of product design.
Neuroergonomics provides a multidisciplinary approach that merges elements of neuroscience, human factors, and ergonomics to study brain response to s

Newsletter | January 2022.
2021 has been full of exciting happenings. Since the very beginning of our adventure, we are dedicated to improve the life of others with neuroscienc
Press Release: Decoding the brain to understand human cognition and emotions.
myBrain Tech has developed its Neuromarkers platform to record, analyze and interpret the brain's electrical signals in real time. With this solution,

[SAVE THE DATE] – AI, conquering emotions in Health!
On Tuesday, November 16, 2021, at 11am, come and listen to Giuseppe Spinelli at the microphone of Pascal Becache on the occasion of the 4th Webinar #P
Computational Psychiatry: how neurotechnology is changing the world of mental health ?
Neuroscience and artificial intelligence are about to revolutionize medicine, especially psychiatry. Neurotechnologies offer a range of new tools base
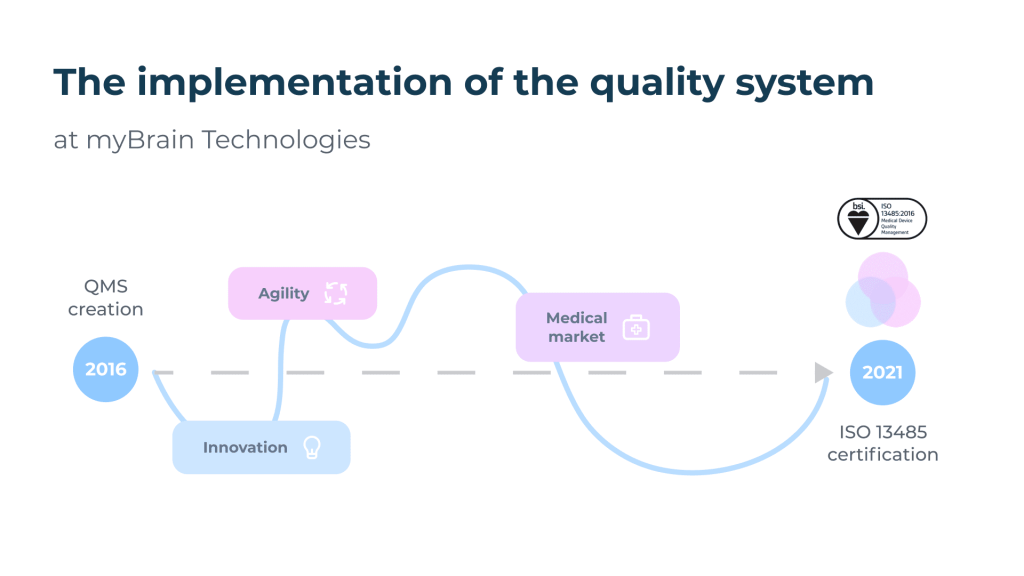
The path to ISO 13485.
Implementing a quality approach within a start-up poses particular difficulties linked to the context of innovation, agility and rapid growth. However
Get in touch
We are glad you are interested in reaching out to us. Whether you have a question about our products or want to give us feedback, we are here to help.

Laisser un commentaire